Using Excel for Data Analysis: An Overview
Excel is a powerful tool that is widely used for data analysis across various fields such as business, finance, and research.
Whether you are working with small or large data sets, Excel offers numerous features that can help you organize, analyze, and visualize your data.
In this post, I will provide a quick overview of how to use Excel for data analysis.
Getting Started with Excel
Before you start analyzing data in Excel, you need to know how to navigate the interface.
Excel has several tabs that contain various features and tools, including Home, Insert, Page Layout, Formulas, Data, Review, and View.
- The Home tab includes basic formatting options such as font, color, and alignment.
- The Insert tab allows you to insert various objects such as charts, tables, and pictures.
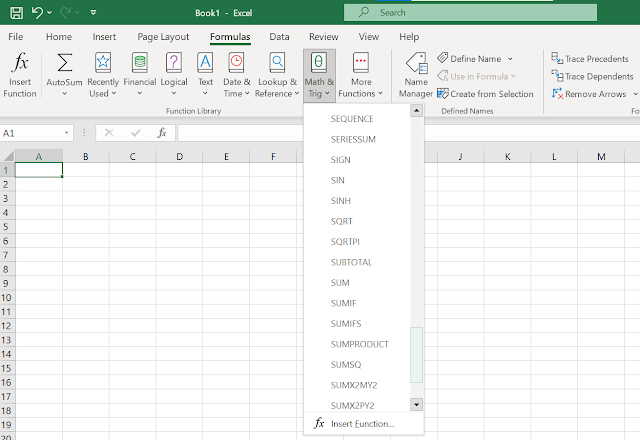
- The Formulas tab includes various mathematical and statistical functions that you can use to analyze your data.
- The Data tab includes various tools for filtering, sorting, and formatting data.
- The Review tab includes proofreading and editing tools,
- while the View tab includes various options for viewing your data.
Organizing Your Data
To analyze data in Excel, you need to organize it first.
Excel offers various options for organizing data, including tables, charts, and pivot tables.
- Tables are used to store and organize data in rows and columns. You can sort, filter, and format data in tables easily.
- Charts are used to visualize data in a graphical format. Excel offers several types of charts, including bar charts, line charts, and pie charts.
- Pivot tables are used to summarize and analyze large data sets quickly. You can use pivot tables to group, filter, and analyze data based on various criteria.
Analyzing Your Data
Once you have organized your data, you can start analyzing it using various tools and functions in Excel.
Excel offers several mathematical and statistical functions that you can use to analyze your data, including SUM, AVERAGE, MAX, MIN, COUNT, and COUNTIF.
You can also use conditional formatting to highlight specific data points based on specific criteria. For example, you can use conditional formatting to highlight cells that contain values above a certain threshold.
Another useful feature in Excel is the Data Analysis Toolpak, which is an add-in that provides various statistical analysis tools, including regression, ANOVA, and t-tests. The Data Analysis Toolpak can help you perform more complex statistical analyses on your data and generate reports quickly.
Visualizing Your Data
Visualizing data is an essential step in data analysis, as it can help you identify patterns, trends, and outliers quickly.
Excel offers several options for visualizing data, including charts, sparklines, and conditional formatting.
Charts are used to visualize data in a graphical format, while sparklines are small charts that are inserted in individual cells. Conditional formatting is used to highlight specific data points based on specific criteria.
Excel also offers the Power BI tool, which is a powerful data visualization tool that can help you create interactive dashboards and reports. Power BI allows you to connect to various data sources, including Excel, SQL Server, and SharePoint, and create dynamic visualizations based on your data.
Sharing Your Data
Once you have analyzed and visualized your data, you may want to share it with others.
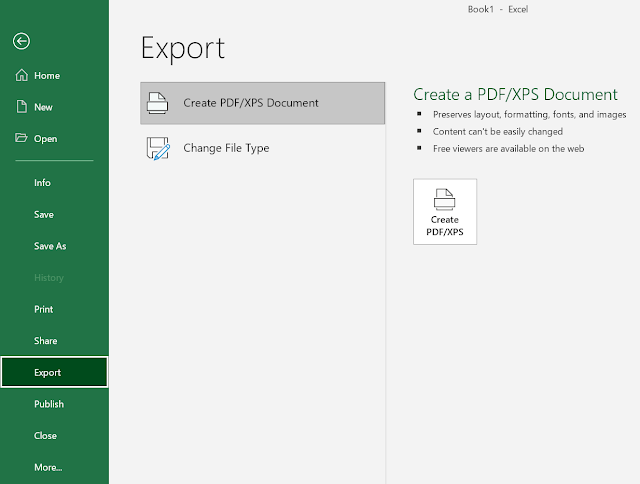
Excel offers several options for sharing data, including saving your workbook as a PDF, sharing your workbook via email, and publishing your workbook to the web.
As you can see, Excel is a powerful tool that can help you organize, analyze, and visualize your data quickly and easily.
Whether you are working with small or large data sets, Excel offers numerous features and functions that can help you perform complex data analysis tasks. By organizing your data, analyzing it using various tools and functions, visualizing your data, and sharing your results, you can gain valuable insights that can help you make informed decisions.


Comments
Post a Comment