Tips for Working with Large Data Sets in Excel
Handling large data sets in Excel can be a daunting task, especially when you're dealing with thousands or even millions of rows and numerous columns.
Excel, with its powerful features, provides the necessary tools to analyze, manipulate, and visualize data effectively.
The following are some valuable tips and techniques that will help you navigate through large data sets efficiently so let's make the most out of Excel's capabilities.
Utilize Filters and Sorting
One of the primary challenges with large data sets is locating specific information.
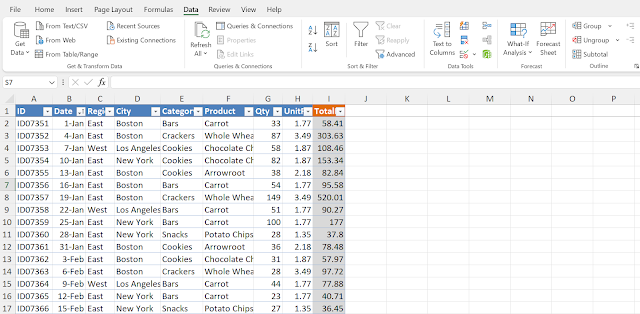
Excel's filtering and sorting functionalities come in handy here. By applying filters, you can quickly narrow down your search and focus on the data that meets specific criteria. To apply a filter, select your data, go to the "Data" tab, and click on the "Filter" button. Excel will add filter arrows to each column, allowing you to filter data based on different conditions.
Sorting is another powerful tool to arrange your data in a meaningful way. You can sort data alphabetically, numerically, or by date. To sort your data, select the range you want to sort, go to the "Data" tab, and choose the appropriate sorting option. Sorting helps you identify patterns, outliers, or trends in your data set, making it easier to draw insights.
Apply Conditional Formatting
Conditional formatting enables you to highlight specific values or cells based on defined conditions, providing visual cues for quick analysis. When dealing with large data sets, conditional formatting can be immensely helpful in identifying outliers, spotting trends, or drawing attention to important data points.
To apply conditional formatting, select the range you want to format, go to the "Home" tab, and click on "Conditional Formatting." Excel offers a variety of formatting options, such as data bars, color scales, and icon sets. For example, you can use a color scale to visualize the distribution of numerical data or apply an icon set to categorize data into different levels.
Use PivotTables
PivotTables are powerful tools in Excel for summarizing, analyzing, and presenting large amounts of data. They allow you to transform rows of data into a concise and structured format, making it easier to extract insights.
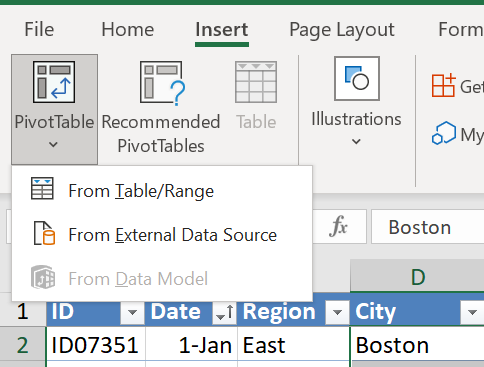
To create a PivotTable, select your data, go to the "Insert" tab, and click on "PivotTable." Choose the location for your PivotTable and then drag and drop the relevant fields into the rows, columns, and values areas. Excel will automatically calculate the summarized data based on the selected fields.
PivotTables provide various features like sorting, filtering, and grouping that enable you to explore your data from different angles. You can quickly generate reports, compare data sets, or drill down into specific details. PivotCharts, which are dynamic charts based on PivotTable data, can further enhance data visualization.
Optimize Calculation Performance
Working with large data sets in Excel can sometimes slow down the calculation speed, causing delays and frustrations. However, there are techniques to optimize performance and make your calculations more efficient.
- Firstly, consider turning off automatic calculation. By default, Excel recalculates formulas every time you make a change, which can be time-consuming for large data sets. To disable automatic calculation, go to the "Formulas" tab, click on "Calculation Options," and select "Manual." Remember to manually recalculate your worksheet when necessary by pressing the "F9" key.
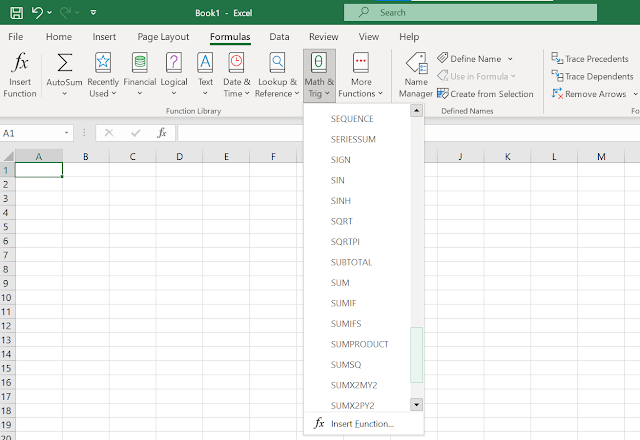
- Another way to speed up calculations is to use the SUMIFS, COUNTIFS, and AVERAGEIFS functions instead of their individual counterparts. These functions allow you to apply multiple criteria simultaneously, reducing the number of calculations required and improving performance.
- Additionally, minimizing the use of volatile functions can help optimize calculation speed. Volatile functions, such as NOW() and RAND(), recalculate every time a change is made in any cell of the workbook. If you have these functions in your formulas and they are not crucial for your analysis, consider removing or replacing them with non-volatile alternatives.
- Another useful technique is to use named ranges instead of referencing entire columns or rows. When working with large data sets, referencing entire columns or rows can significantly slow down calculations. By defining named ranges for the specific data you need, you reduce the computational load on Excel, resulting in faster performance.
Splitting Data into Multiple Worksheets
Managing large data sets in a single worksheet can be overwhelming and prone to errors. Splitting your data into multiple worksheets based on categories or criteria can improve organization and simplify analysis. Here's how you can achieve this:
- Identify the criteria for splitting your data. For example, if you have sales data, you may want to split it by region, product, or time period.
- Create separate worksheets for each category. Rename the worksheets accordingly.
- Use filtering or sorting techniques to extract the relevant data for each worksheet.
- Copy and paste the extracted data into the corresponding worksheets.
- Repeat the process for each category until your data is distributed across different worksheets.
By splitting your data, you can focus on specific subsets of information, making it easier to analyze and interpret. It also reduces the file size, improving performance when working with the data.
Working with large data sets in Excel can be a challenging task, but with the right techniques and strategies, you can navigate through the complexities effectively.
By utilizing filters and sorting, applying conditional formatting, leveraging PivotTables, optimizing calculation performance, and splitting data into multiple worksheets, you can enhance productivity, extract meaningful insights, and streamline your analysis process.
Excel offers a vast array of features and functionalities that empower you to tackle large data sets with confidence.
Incorporate these tips into your Excel workflow, and you'll be well-equipped to handle large data sets efficiently, saving time and increasing productivity along the way.
( Data samples : https://www.contextures.com/xlsampledata01.html )


Comments
Post a Comment